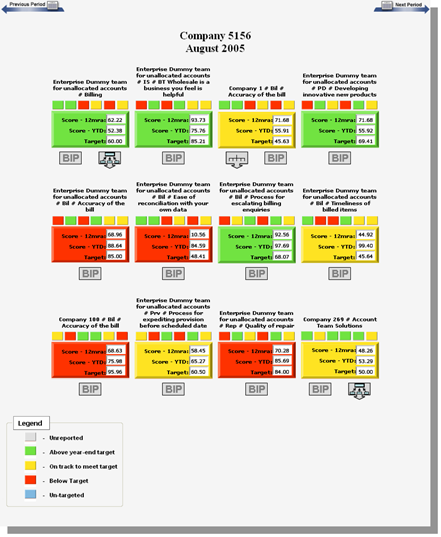
Dashboard Screen: The dashboard page displays the overall health of key performance indicators. Each box represents a key performance indicator (KPI) and the health for corresponding periods. The default executive dashboard shown can be unique to the individual logged in, or shared by the entire organization.

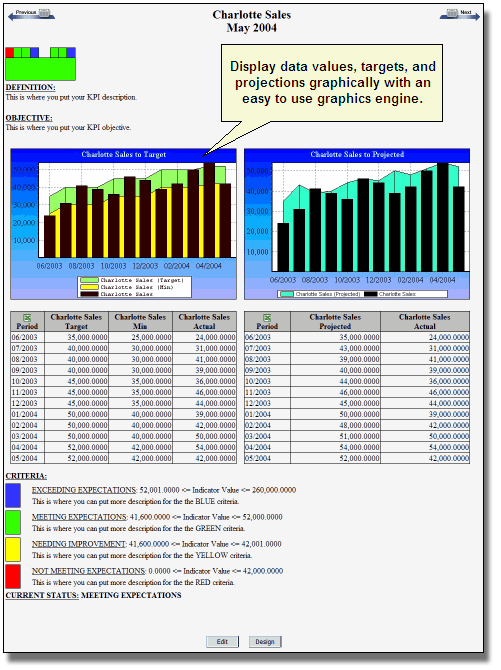
View Screen: The View screen gives a snapshot picture of the key performance indicator (KPI). Charts display supporting data, while text details the criteria and justification for each KPI.

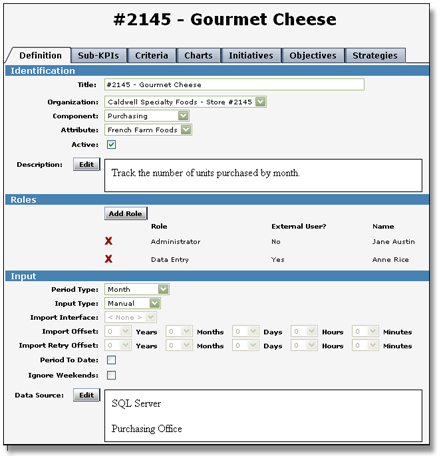
Design Screen: The design screen allows all elements of a key performance indicator (KPI) to be customized, including sub-indicators, charts, measures, criteria, and display properties.

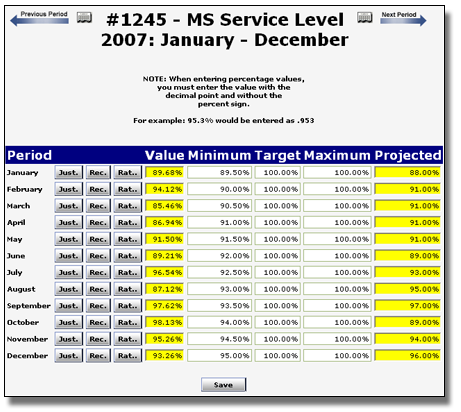
Edit Screen: The Edit screen displays the data and projections for the given key performance indicator - KPI. Rationale, justification, and overrides can be entered here.

